


SandScan
The SandScan sensor is a
derivative of the WHAPS sensor, using the same electronics
and case but a different transducer. It was built rather
quickly to provide a field sensor to test the hypothesis
that algae in the sediments could and would produce oxygen
that, under proper circumstances, could come out of
solution and form bubbles -- thus enhancing the scattering
strength of the bottom by a potentially large amount. The
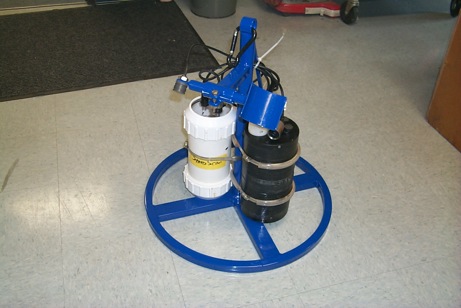
original version of SandScan was self-contained (as shown
above). It was dropped to the bottom and began taking
backscattering measurements of the bottom using the
transducer mounted on an arm at a 45 degree angle to the
center post. Backscattering was measured at several
frequencies from 600 to 900 kHz and the intensities simply
summed into a single value that was saved, along with the
time, in the (small) internal memory of the CPU card. Data
were taken at programmed intervals. The device could be
left in place for up to several days and the data
downloaded after retrieval.
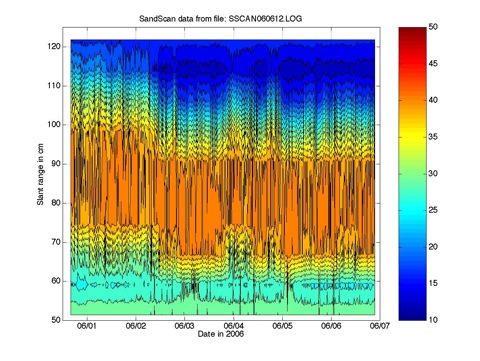
The figure below is a contour plot of relative
backscattered intensity vrs range and time for a period in
June of 2006 off Scripps Pier.
Recently, I have modified
SandScan to take backscattering data at seven frequencies
around 250 kHz and output the echo amplitudes after every
ping. We will be able to observe trends in bottom
backscattering and also inspect echo statistics with this
data set. I have built a datalogger to fit inside a case
identical to the electronics case, using a TAPS-6 NG CPU/IO
card with a CF-RAM card to hold the data. It should be good
for at least a week of data at fairly rapid intervals. We
purchased a birdcam that we enclosed in a
plexiglas box to take timed pictures of the bottom so we
can observe wave and biological perturbations as well.
We have data from several deployments. The first several
were done in a local bay where the water was quite turbid.
Although the light levels were reasonably high at the
bottom, we found no evidence that the interstitial
phytoplankton were producing oxygen at a rate sufficient to
produce bubbles. This July, however, we (Dave Thistle and
grad students @ FSU) deployed the SandScan in very shallow
water in Port St. Joe Bay, FL. The plot below shows the
diel evolution of bottom backscattered echo level (in dB)
as a function of time and of frequency. There is clear
evidence of bubble evolution and dramatic increases in echo
level after sunrise each day. The slower trend towards
increased night-time scattering levels is harder to
explain. The only clue so far is that this week-long
deployment corresponded to the change from neap to spring
tides.
FIGURE REMOVED
TEMPORARILY
This figure is very similar to
the result obtained in aquarium experiments we (Van
Holliday and I) conducted in the lab in San Diego in 2003.
We obtained sand from Panama Beach, FL and innoculated it
with local algae from Mission Bay. We set the aquarium by a
window covered with window film to reduce ambient light
levels to those expected at a few meters depth in the
ocean. Ensonifying the surface with a broadband transducer,
we recorded 32-ping coherent average waveforms. Data
processing consisted of computing echo spectra and
normalizing these by a similar spectrum taken at the
beginning of the experiment. Those data covered a frequency
range of about 150 - 1000 kHz. The results showed that the
bulk of the enhanced scattering occured at the lower
frequencies -- up to ca. 350-400 kHz, characteristic of gas
bubbles. This result drove our modification of SandScan to
use frequencies in the 250 kHz range.